





For years, national and campus surveys—including The Hope Center's national Student Basic Needs Survey—have documented widespread food insecurity, housing insecurity, and homelessness among college students. In 2023, for the first time, the Department of Education released new federal data on several measures of basic needs insecurity, including food insecurity and homelessness. Now, new federal longitudinal data show that student basic needs insecurity is not a temporary disruption or a product of short-term economic disruptions. Rather, it is a persistent challenge that follows many students throughout their college careers.
In March, the National Center for Education Statistics (NCES) released new federal data on the experiences of students in higher education who began college in academic year (AY) 2019–20 and were surveyed again in AY 2021–22. The data confirm that students continued to struggle intensely with basic needs insecurity. These challenges are not just a momentary experience—they persist throughout students’ time in college.
These new data, from the Beginning Postsecondary Students Longitudinal Study (BPS:20/22), supplement the first nationally representative data on college students’ experiences with food insecurity and homelessness collected through NCES’s National Postsecondary Student Aid Study (NPSAS:20), which was released in 2023. Those data confirmed what voluntary campus-based surveys had shown for years: basic needs hardship was pervasive at all types of institutions, especially dire among Pell Grant recipients, Black, Latino/a, parenting students, and students from low-income and working-class backgrounds.
BPS:20/22 expands our knowledge by following the NPSAS cohort of first-time beginning students who entered college in academic year (AY) 2019–20 and surveying them again two years later, in AY 2021–22. The timing of the surveys is noteworthy. The initial cohort was dealing with the onset of the COVID-19 pandemic and the intense disruptions that came with it, while the follow-up took place as temporary federal supports had kicked in, including emergency aid, expanded Supplemental Nutrition Assistance Program (SNAP, formerly “food stamps”) emergency allotments, and the federal student loan payment pause, and were being delivered to students. The findings use nationally-representative data to confirm that student basic needs insecurity was not a temporary phenomenon resulting from an unprecedented pandemic, or something that students only struggle with as they adjust to college life, but a persistent, ongoing challenge to student success.
Both research and experience suggest that students who struggle to meet their basic needs often face greater barriers to persistence and completion.
The BPS survey also includes students who were no longer enrolled by AY 2021–22, not just those who remained in school. That matters because students facing the greatest hardship were among those most likely to leave college. Finally, while NPSAS:20 data provided insight into student homelessness, BPS broadens the federal picture of students' hardship with new data on student housing; the BPS survey measures overall housing insecurity—the first time such an inclusive variable has been included in a federal higher education survey.
Student Basic Needs Insecurity Remains Pervasive
In AY 2021–22, hardship remained widespread among enrolled students in the BPS follow-up cohort. Overall, 21.2% experienced food insecurity at follow-up—12.6% at the most severe level (very low food security) and another 8.6% at low food security. Another 10.3% had only marginal food security.
A total of 5.5% of students reported recent homelessness, and 18.6% experienced housing insecurity at follow-up. Taken together, nearly one in three enrolled students (31.6%) experienced at least one of these forms of hardship. These figures make clear that basic needs insecurity remained a central part of many students’ college experience, even after the immediate shock of the pandemic’s onset had passed.
Figure 1. | Basic needs hardship among enrolled students, AY 2021-22

These rates are modestly lower than those reported in the NPSAS:20 data because many of the students who experienced hardship in NPSAS were no longer enrolled by follow-up. Students facing the most severe hardship were among those most likely to have left college by the follow-up period, so lower rates are observed with our focus on the still-enrolled population. In BPS, 35.3% of students who were food insecure in Year 1 were not enrolled by AY 2021-22, compared with 24% of students who were food secure or marginally food secure. Similarly, 35.7% of students who reported homelessness in Year 1 were not enrolled, compared with 25.3% of students who did not report homelessness.
This makes intuitive sense: students struggling to afford food, housing, or other basic needs are less likely to be able to continue their degree program, while those who remain are a population disproportionately able to meet their material needs and focus on their coursework.

Note: NPSAS:20 estimates describe undergraduate students enrolled during AY 2019–20. BPS:20/22 estimates describe first-time beginning students who were still enrolled at the AY 2021–22 follow-up. Because the populations differ, the estimates should not be read as a direct trend. BPS:20/22 adds a broader housing insecurity measure that was not available in NPSAS:20.
Hardship Was Not Equally Distributed
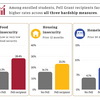
Looking at these prevalence rates by subgroup reveals large and consistent disparities. Pell Grant receipt is one of the clearest dividing lines in the data. Among enrolled students, Pell Grant recipients had nearly double the rate of food insecurity as non-Pell students, 28.4% compared with 16.3%. Pell recipients also had nearly double the rate of homelessness, 7.5% compared with 4.1%, and substantially higher housing insecurity, 23.3% compared with 16.1%. While the Pell Grant program is our largest financial aid program aimed at addressing the price disparity facing low- and moderate-income students, the grant’s purchasing power has declined steadily over the past several decades. As a result, the grant is insufficient to mitigate the ways that economic disadvantage shapes basic needs insecurity.
Figure 2. | Pell Grant recipients faced higher rates of hardship, AY 2021-22
Racial disparities were substantial. Black students had a food insecurity rate of 32.3% and a homelessness rate of 9.4%, nearly double the rates of White students. Hispanic students and students of more than one race also had higher hardship rates than White and Asian students. Estimates for American Indian or Alaska Native and Native Hawaiian or Pacific Islander students were especially high but are less precise due to smaller sample size.
Figure 3. | Black and Latino/a students faced greater hardship, AY 2021-22

Institution type mattered too: students at private for-profit institutions stood out across all three hardship measures, with a food insecurity rate of 33.6%, a homelessness rate of 10.5%, and a housing insecurity rate of 34.1%—notably higher than public or private non-profit colleges. Age differences were also pronounced: students ages 24 to 29 had the highest food insecurity rate of any age group at 30%, and the highest homelessness rate at 9.2%. This was nearly twice the homelessness rate among students ages 15 to 18 (the dual-enrollment or early college population) and substantially higher than the rate among students ages 19 to 23. Students with dependent children faced elevated hardship as well, with a food insecurity rate of 32.6% and a housing insecurity rate of 37.9%.

Note: Estimates for American Indian or Alaska Native and Native Hawaiian or Pacific Islander students are flagged for higher relative standard errors in PowerStats and should be interpreted with caution.
Student Hardship Remained Common and Persisted from Year 1 to 3
Among students who began in AY 2019–20 and were still enrolled in AY 2021–22, food insecurity actually rose over the two-year period, increasing from 17.6% in year one to 21.2% at follow-up. Student homelessness moved in the opposite direction, falling from 7.8% in AY 2019–20 to 5.5% in AY 2021–22i.
That decline in homelessness does not mean housing hardship improved for the cohort as a whole. Students facing persistent homelessness were among those most likely to leave college, meaning the enrolled population at follow-up no longer included many of them. The data support this: persistent homelessness was notably higher in the full cohort than among those who remained enrolled. Pandemic-era supports, including Higher Education Emergency Relief Fund (HEERF) grants, expanded SNAP benefits, and the student loan payment pause, may have also helped some students become housed.
For many students, hardship was not a brief disruption, and those who struggled at college entry were most likely to face challenges in the future. Among students still enrolled, more than 4-in-10 (43%) of those who were food insecure in AY 2019–20 were still food insecure two years later. By contrast, 16.6% of those who were food secure in year one had become food insecure by year three. Among those who had experienced homelessness in year one, 18.8% were still experiencing homelessness at follow-up, while 4.4% of those who had not experienced homelessness in year one reported homelessness by year three.
A Broader View of Housing Insecurity
One of the most important additions in BPS is its broader housing insecurity measure, which expands the federal picture beyond measures of homelessness used in NPSAS. Drawing from the U.S. Census Bureau’s Survey of Income and Program Participation (SIPP) Adult Well-Being Module, the housing insecurity measure asks whether students did not pay the full amount of rent or mortgage, did not pay the full amount of utility bills, had utility service disconnected, or were forced to move in with others due to financial problems, all within the prior 12 monthsiii.
Among enrolled students, 5.5% reported recent homelessness. When housing insecurity is considered alongside homelessness, roughly one in five enrolled students (19.9%) experienced some form of housing-related hardship. The 14.4 percentage-point difference represents students whose hardship would be missed by a homelessness-only lens. The two measures capture related but distinct experiences. Among students who reported recent homelessness, 76.1% also reported housing insecurity. At the same time, 15.2% of students who did not report homelessness still reported housing insecurity. In other words, most homeless students were also housing insecure, but a substantial share of housing-insecure students were not homeless.
The BPS housing insecurity measure is derived from the SIPP Adult Well-Being Module. The Hope Center’s Student Basic Needs Survey uses a comparable definition but includes additional items, such as difficulty finding affordable housing near campus, which may contribute to higher rates in campus surveys.
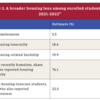
Food Insecurity, Housing Insecurity, and Homelessness Intersect and Overlap
The BPS follow-up data show that food insecurity, housing insecurity, and homelessness were closely linked in AY 2021–22. An adjusted logistic regression modelv predicting homelessness found strong same-period associations between homelessness, food insecurity, and housing insecurity even after accounting for demographic and financial characteristics.
Compared with food-secure students, food-insecure students had 3.10 times the odds of experiencing homelessness. Housing insecurity showed the strongest same-period association in the model: students experiencing housing insecurity had 11.93 times the odds of also reporting homelessness. While these findings do not necessarily show that one hardship caused another, they do indicate that different forms of hardship often overlapped in students’ lives. The next post in this series will examine whether early hardship in year one predicted later outcomes, including whether food insecurity at college entry was associated with homelessness, academic performance, and persistence at follow-up.
Emergency Aid Was Available, But Most Students Did Not Know It
The BPS follow-up took place during the period when the federal government had directed nearly $40 billion in emergency aid to students through the HEERF. When that aid reached students, it helped cover basic costs. A 2022 NASFAA national surveyvi found that students most often used emergency funds for food, housing, books and supplies, and transportation, and that many said the aid reduced stress, improved focus, and helped them stay enrolled.
At the same time, the BPS data show issues with the visibility and reach of emergency aid. Only 26.4% of enrolled students reported that their institution offered emergency financial assistance, while 69.1% said they did not know whether such aid was available. Lack of awareness was high across groups facing the most hardship. Among students experiencing homelessness, 62.6% said they did not know whether aid was available. Among students with high food security, 70% said the same. A 2025 EdTrust analysisv confirmed wide institutional variation in how emergency aid was communicated.
Among students who applied for emergency aid, large numbers received it, suggesting that awareness posed a greater barrier than the application process itself. Of enrolled students in scope for the BPS emergency-aid questions, 44.0% applied, and 92.9% of applicants received assistance. Students experiencing homelessness applied at higher rates than non-homeless students (57.9% compared with 43.0%), suggesting that when students knew about available aid, acute need pushed them to seek it. For this cohort, lack of awareness served as the major barrier to emergency aid.
When HEERF aid expired and systemic federal investment in emergency aid ceased, states and institutions continued to operate emergency aid programming on a more limited basis. Today, need continues to outpace available funding across nearly all emergency aid programs. State and federal policymakers should work to create permanent, predictable, and expanded funding streams for institutions, including by creating flexibilities within existing campus-based aid programs. In addition, institutional leaders and policymakers should continue to ensure that students are aware of emergency aid funding where it exists and that application processes are communicated clearly and in a timely manner.

Note: The 92.9% emergency-aid receipt figure applies only to students who applied and were within the scope of the BPS emergency-aid questions. It is not a population-level receipt estimate.
Implications for Colleges, Advocates, and Policymakers
The BPS follow-up makes clear that the basic needs crisis documented in NPSAS did not disappear as students moved through college. In many cases, basic needs insecurity accumulated the longer students were enrolled. More than one in five enrolled students experienced food insecurity in AY 2021–22, and nearly one in five experienced housing insecurity. These are federal follow-up data, not results from a single campus or a self-selected group of institutions. They show that hardship remained a central part of students’ college experience.
The follow-up data also show that hardship was often persistent: a meaningful share of students who entered college experiencing serious hardship were still facing it two years later. These data suggest that providing short-term emergency supports alone will be insufficient for responding to college students’ basic needs insecurity.
The findings also underscore the importance of measuring housing hardship more fully, because a homelessness-only approach misses a large share of students experiencing serious housing instability. Institutions, policymakers, and advocates should build data systems, screening tools, and intervention strategies that reflect the broad range of housing hardships students face.
The emergency-aid findings point to a simple but important lesson: support cannot help students if they do not know it exists. Durable and visible systems of support matter. That includes clearer communication, better outreach, and stronger connections between basic needs supports and the parts of campus students already encounter, including financial aid offices, advising, and student services.
Students who stopped out are also an essential part of this story, because the follow-up data suggest that those facing homelessness and severe food insecurity in year one were more likely to have left college by year three. Data that focus only on currently enrolled students do not always capture the full extent of hardship. That is one reason these federal longitudinal data matter so much: they do not just show who remained. They also help illuminate who stopped out along the way. Unfortunately, that longitudinal view is under threat. Recent federal contract cancellations have put BPS at risk —and with it, the only federal data source capable of tracking how basic needs insecurity evolves across students' time in college.
Related Reading:
- The State of State Emergency Aid for College Students (March 2026)
- The Hope Center’s 2026 Federal Policy Priorities (February 2026)
- Making College Financial Aid Flexible and Responsive: The Case for Continuing the Federal Investment in Emergency Grants (August 16, 2023)
- New Federal Data Confirm that College Students Face Significant—and Unacceptable—Basic Needs Insecurity (August 3, 2023)
- Best Kept Secrets: The Federal Government Expanded SNAP Eligibility for College Students, But Many Never Heard About It (July 2022)
- When Care Isn’t Enough: Scaling Emergency Aid During the Pandemic (October 2021)
Methodology
BPS:20/22 data are publicly available through the NCES PowerStats tool at https://nces.ed.gov/datalab/powerstats/.
BPS:20/22 data were analyzed using NCES PowerStats with the full sample weight WTA000. All estimates are weighted to represent the national population of first-time beginning postsecondary students, and standard errors account for the complex sample design. Unless otherwise noted, all estimates describe students who remained enrolled at follow-up (filtered by Attendance intensity pattern, AY 2021–22 = Full-time, Part-time, or Mixed)
Food security was assessed using the USDA Adult Food Security Survey Module, which classifies respondents into four categories: high food security, marginal food security, low food security, and very low food security. "Food insecure" refers to students with low or very low food security combined. Low food security indicates reduced quality or variety of diet, while very low food security indicates disrupted eating patterns and reduced food intake. All figures in this post use the combined food insecurity measure (low + very low) unless otherwise noted. The reference period is the 30 days prior to survey completion.
Age ranges in Table 2 reflect the predefined categories available in NCES PowerStats, based on students' age as of December 31, 2019 (15–18, 19–23, 24–29, and 30 or older). Students as young as 15 appear in the BPS cohort because the study includes students enrolled in dual enrollment and early college programs, which allow high school students to earn postsecondary credit.
HOMELESS22 refers to the 30 days prior to survey completion. HOUSESEC22 refers to the prior 12 months. Because the two measures use different reference periods, the combined housing hardship estimate should be interpreted as a broader BPS-specific descriptive picture rather than a direct like-for-like comparison.
The BPS enrolled-only estimate of 18.6% housing insecurity provides an important federal baseline. It is notably lower than other surveys, such as The Hope Center’s 2023–2024 Student Basic Needs Survey Report, which found a housing insecurity rate of roughly 47.8%, but the two figures serve different purposes. The BPS estimate reflects a nationally representative sample of students in their third year of college, weighted to represent the national population of students who first entered postsecondary education in AY 2019–20. Campus survey estimates, by contrast, often reflect institutions serving more economically vulnerable populations and may include a broader range of students, such as continuing and non-credit students, who are not part of the BPS cohort. The federal estimate should be understood as a national floor, not a ceiling.
[i] BPS measures sex assigned at birth as a binary variable; the categories shown reflect the survey instrument and do not capture gender identity.
[ii] There is no directly comparable enrolled-only housing insecurity measure from year one.
[iii] The BPS housing insecurity measure is derived from the SIPP Adult Well-Being Module. The Hope Center’s Student Basic Needs Survey uses a comparable definition but includes additional items, such as difficulty finding affordable housing near campus, which may contribute to higher rates in campus surveys.
[iv] Unless otherwise indicated, estimates in this table are percentages of enrolled students. The 76.1% figure is conditional on reporting recent homelessness. The gap between homelessness and housing insecurity reflects a reference period difference: HOMELESS22 captures the prior 30 days, HOUSESEC22 the prior 12 months.
[v] The adjusted logistic regression model predicting homelessness controlled for food insecurity (binary: low or very low food security vs. high or marginal food security), housing insecurity, race and ethnicity, age, sex assigned at birth, sexual orientation, and Pell status. Reference groups were: food secure, no housing insecurity, White, ages 15–23, male, straight, no Pell grant.
[vi] NASFAA, NASPA, and HCM Strategists (2022). Evaluating Student and Institutional Experiences with HEERF. National Association of Student Financial Aid Administrators. https://www.nasfaa.org/evaluating_heerf_report
[vii] EdTrust (2025). Tracking the Reach of Emergency Relief Funds During the Pandemic. The Education Trust. https://edtrust.org/wp-content/uploads/2025/04/HEERF-Quant-Analysis-V4.pdf