


Last week, the National Center for Education Statistics (NCES) at the U.S. Department of Education released a major federal report confirming that students in higher education are struggling to meet their basic needs.
For the first time in its 36-year history, the federal government released data on students experiencing food insecurity and homelessness as part of the National Postsecondary Student Aid Study (NPSAS). As a result, the 2019-20 National Postsecondary Student Aid Study (NPSAS:20) contains the first nationally representative data on food insecurity and homelessness among undergraduate and graduate students enrolled in postsecondary education in the United States. The newly released statistics confirm that colleges and universities of all types serve undergraduate and graduate students experiencing food insecurity and homelessness. Overall, 23% of undergraduates, and 12% of graduate students, are experiencing food insecurity. This means more than 4 million students are food insecure. And eight percent of undergraduate and 5% of graduate students are experiencing homelessness, translating to more than 1.5 million students.
The NPSAS:20 data include responses from about 80,800 undergraduate students and 19,700 graduate students attending 2,200 postsecondary institutions in the 50 states, the District of Columbia, and Puerto Rico, with a response rate of 60.0%. According to NCES, the results represent 17.1 million undergraduate and 3.6 million graduate students enrolled at Title IV eligible institutions at any time between July 1, 2019, and June 30, 2020—totals adjusted for students enrolled in more than one institution.
It is important to note that the NPSAS:20 survey was fielded in March 2020, just as the pandemic began, which NCES aptly describes as a “period of flux and uncertainty” in higher education. In that same month, COVID-19 cases began to spread, and a national emergency was declared in the United States, alongside extraordinary disruptions for students and their families. These circumstances may affect the comparability of NPSAS:20 data to prior NPSAS surveys and highlight the importance of collecting data over time to shed light on how national or global events, and policy changes, shape student basic needs security.
Later this fall, The Hope Center will release its own student basic needs survey results from surveys of students conducted in spring 2023. Our last student basic needs survey was fielded in the fall of 2020. The Hope Center’s survey—collected in partnership with institutions—asks students about a broader array of basic needs than NPSAS:20 covers, including housing, transportation, child care, public benefits, mental health, technology, and other areas critical for student success. Our survey and new data dashboard allow colleges and universities to obtain nuanced data at the institution level, helping them understand their students’ needs, access to supports, resource preferences, and more.
The Hope Center is proud to have contributed to developing the NPSAS:20 survey questionnaire and thanks NCES for the inclusion of these important new measures. Below are a few of the key findings from NPSAS:20, which include findings in food insecurity, homelessness, emergency aid, and financial security.
Food Insecurity
Based on the data from NPSAS:20, 22.6% of undergraduate students report low or very low food security in the last 30 days, and another 11.9% report marginal food insecurity. Using NCES’ enrollment data, approximately 3.9 million undergraduates experience food insecurity (“food insecurity” is defined here as students who have low or very low food security). This food insecurity rate among undergraduate students is more than double the food insecurity rate among all U.S. households, which the U.S. Department of Agriculture estimates was 10.5% in 2020.
Additionally, 12.2% of graduate students report low or very low food security, and another 8.6% report marginal food security. This translates to more than 400,000 graduate students experiencing food insecurity. Before the release of this NPSAS:20 data, there was relatively little information available about the basic needs of graduate students.
Taken together, the NPSAS:20 data confirm that more than 4 million students in higher education are experiencing food insecurity, and 2.3 million more students have marginal food security. The Hope Center previously found higher rates of food insecurity than NPSAS:20. In our most recent student basic needs survey, conducted in fall of 2020, we found that 34% of college students experienced food insecurity.
These differences may be partially attributable to the differences in the study sample, response bias, timing of the survey, applied weights in data analysis, methods used to deal with missing data, and other factors. For example, while NPSAS:20 surveyed students at 2,200 postsecondary institutions spread throughout all 50 states in the U.S., the District of Columbia, and Puerto Rico, The Hope Center’s survey was administered voluntarily by 202 institutions in 42 states that demonstrated a willingness to tackle the difficult issue of basic needs insecurity and uncover hard truths. We find considerable institutional variation in basic needs insecurity within our sample (for example, for community colleges participating in fall 2020, rates ranged from 13% to 60%); the colleges that proactively sought us out to assess basic needs among their students may experience food insecurity at rates higher than the national average. An in-depth comparison will be released at a later time, featuring additional information on the methodology employed by NCES to conduct the analysis.
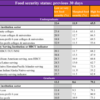
Sector: Among undergraduates, food insecurity is higher at community colleges (23.4%) than public and private non-profit 4-year institutions (20.9% and 18.8%, respectively). Food insecurity rates are highest at for-profit colleges (32.9%) among all sectors. Little data was previously available about the experiences of for-profit college or private non-profit students, making these data notable. Students attending for-profit colleges face higher costs than those in other sectors. In this analysis, we define “community colleges” to include both public 2-year institutions and those public 4-year institutions that confer mainly sub-baccalaureate awards (certificates and associate degrees), given the rising number of community colleges that award bachelor’s degrees.
As with undergraduates, food insecurity within the graduate student population was highest at for-profit colleges (16.0%). However, there are still notable levels of student food insecurity among graduate students at public colleges (11.4%) and private non-profits (11.9%).
Table 1: Food security status among students by institution sector
HBCUs, TCUs, and MSIs: Compared to the national average, students enrolled at Historically Black Colleges and Universities (HBCUs), Tribal Colleges and Universities (TCUs), and most other types of Minority-Serving Institutions (MSIs) experience higher levels of food insecurity. Nearly 2 in 5 undergraduate students at HBCUs (38.8%) and more than 1 in 3 students at TCUs (35.5%) report food insecurity. The Hope Center similarly found and reported high levels of basic needs insecurity among the 14 HBCUs and approximately 5,000 HBCU students that participated in our fall 2020 survey.
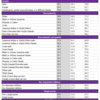
Race and ethnicity: Among undergraduate students, the NPSAS:20 data demonstrate alarming inequities between racial and ethnic groups in food insecurity. Black or African American students report the highest levels of food insecurity, with more than a third (34.6%) indicating food insecurity. Native Hawaiian or other Pacific Islander students and American Indian or Alaska Native students followed closely, with reported rates of 32.6% and 29.9%, respectively. In contrast, the reported rate of food insecurity for White students (18.0%) and Asian students (17.6%) is nearly half of that of their Black or African American peers. There are also significant disparities among graduate students—almost 1 in 5 Black graduate students (22.2%) are experiencing food insecurity, compared to 8.5% of White graduate students. Within undergraduate students who identify as Asian, there are significant gaps—with a larger percentage of Vietnamese students experiencing food insecurity (22.1%) than Chinese or Asian Indian students (12.9% and 14.9%, respectively).
Gender: There are differences in the rate of food insecurity by gender. Among undergraduates, women report higher levels of food insecurity (24.3%) than men (19.7%). The report also finds troubling levels of food insecurity among students identifying as genderqueer, gender nonconforming, or another non-binary gender (35%). The full release of the NPSAS:20 restricted-use data file (RUF) will allow further analyses of food insecurity and homelessness rates among LGTBQ+ students.
Intersection of race and gender: At the intersection of race and gender, there are even larger inequities demanding a response from higher education policymakers and leaders. Pacific Islander/Hawaiian women face the highest rates of food insecurity (37.7%) among all racial and ethnic groups, followed closely by Black women (35.7%) and Black men (32.2%). White men had the lowest levels of food insecurity, at 15.2%. These findings highlight that addressing basic needs insecurity is an equity imperative.
Parenting status: Among undergraduates, rates of food insecurity are notably higher (28.7%) among parenting students (those who have dependent children) than students who do not have children (21.2%). The proportion of students who are single parents and facing food insecurity is even higher, with an alarming 37.3% reporting low or very low food security. These data are consistent with results from The Hope Center. We consistently find higher rates of basic needs insecurity among parenting students relative to non-parenting students, including significant racial disparities.
Pell Grant recipients: Among undergraduates who are Pell Grant recipients, 31.1% reported low or very low food security. However, the food insecurity rate of students who are not Pell Grant recipients is still an alarming 16.8%. Although receiving Pell Grants is often considered an indicator of financial need, many students are not eligible for Pell Grants, and the program imposes significant administrative burdens on students to qualify and maintain eligibility, even if they are struggling to afford college costs. Some dependent students from families with higher income levels that disqualify them from Pell Grants may not actually receive support from their parent(s) to help pay for college costs, leading to them to experience basic needs insecurity.
Disability: Nearly 36% of undergraduate students with a disability experience food insecurity compared to 19.1% of undergraduates without a disability. Among graduate students there are similar gaps—26.4% of graduate students with a disability are experiencing food insecurity, a rate that is more than double the 10.5% of graduate students without a disability.
Table 2: Food security status among undergraduate students by gender, race, parenting status, disability, and Pell Grant recipient status
Homelessness
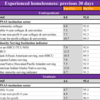
The NPSAS:20 data show that 8.0% of undergraduate students, and 4.6% of graduate students, report experiencing homelessness in the previous 30 days. This translates to approximately 1.4 million undergraduates, and 166,000 graduate students, experiencing homelessness nationwide.
In prior versions of NPSAS, students were asked if they had received a “determination of homelessness” within the previous year—a financial aid procedure available only to students 23 years of age or younger—or answered questions on the FAFSA related to homelessness. Not all who experience homelessness get a determination or indicate homelessness on the FAFSA. These new data provide a more timely picture of the lived experiences of students, rather than just their financial aid processing status.
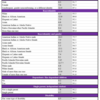
Notably, undergraduate students attending for-profit colleges display the highest rate of homelessness of all sectors, with a rate of 10.7%. The data also reveal concerning rates (12.9%) of homelessness among undergraduate students who identify as genderqueer, gender nonconforming, or with another non-binary gender identity. Alarmingly, 15% of American and Indian or Alaskan Native students and 12% of Black or African American students experienced homelessness. Comparatively, 6.5% of White students and 6.8% of Asian students reported experiencing homelessness. The data highlight the urgency of addressing these disparities to support the success of all students, regardless of their gender, racial, or other backgrounds.
Table 3: Homelessness status by institution sectors
In The Hope Center fall 2020 survey, we found that 14 percent of students experienced homelessness in the prior year. While NPSAS:20 asked students about experiencing homelessness in the previous 30 days, The Hope Center survey identifies students who may currently be housed but experienced a period of homelessness in the last 12 months. Capturing experiences of episodic, transitional, or hidden homelessness is relevant for policy, student supports, and understanding impacts on academic outcomes.
Table 4: Homelessness status among undergraduate students by gender, race, parenting status, disability, and Pell Grant recipient status
NPSAS:20 did not ask students about other forms of housing insecurity that could significantly impact their success, but which fall outside the parameters of the statutory definition of homelessness. The Hope Center’s fall 2020 survey measured housing insecurity using a nine-item set of questions related to challenges that prevent someone from having a safe, affordable, and consistent place to live—such as inability to pay rent or needing to move frequently. We found that nearly half of students—48 percent—were experiencing housing insecurity. We look forward to working with NCES to gather additional information on students’ experiences with housing in future surveys.
Emergency Aid
NPSAS:20 provides some information on the students who received emergency aid, a type of grant aid which helps students cover unexpected expenses. However, most of the federal funding for emergency aid was provided to students after the period of this NPSAS:20 survey, which may limit the conclusions drawn from this data.
Nevertheless, 13.0% of undergraduate students report receiving emergency aid in NPSAS:20. The rate of students receiving emergency aid varies significantly across different types of institutions: 18.2% of undergraduate students from public 4-year institutions received emergency aid, but only 11.1% of students from community colleges received this aid. At private non-profit 4-year colleges and for-profit colleges, 8.9% and 7.7% of undergraduate students received emergency aid, respectively. The COVID-19 relief bills passed by Congress contained different levels of investment in emergency aid for different sectors of higher education.
Notably, just 16.2% of undergraduates with low or very low food insecurity received any emergency aid. The vast majority (83.8%) of students experiencing food insecurity did not receive emergency aid. These data suggest that further analysis could be useful to determine how emergency aid can best be distributed to alleviate basic needs insecurity.
Table 5: Percentage of undergraduate students receiving emergency aid by institution sectors
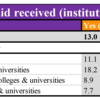
Table 6: Percentage of undergraduate students receiving emergency aid by race, gender, parenting status, disability, and Pell Grant recipient status
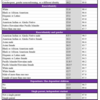
Financial Security
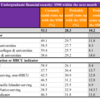
Nearly 1 in 5 undergraduates (18.5%) report that they certainly, or probably, could not come up with $500 if they faced an unexpected financial need in the next month. At HBCUs, more than 1 in 4 undergraduates (25.9%) probably or certainly could not come up with $500 in the next month. At TCUs, that number is 28.6%. Among undergraduate parenting students, 27.8% could not come up with $500, compared to 16.5% of students without children—consistent with other indicators that parenting students face outsized financial pressures due to the cost of child care and other time and cost burdens.
Table 7: Financial security among undergraduate students by institution sectors
Working while in college
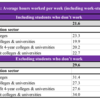
On average, undergraduates report working 21.6 hours per week (including work-study fellowships). The number of hours is relatively stable across all institution types, with students at community colleges working hours slightly above the national average (23.3%). Excluding students who don’t work (report zero hours), reveals that students with jobs work an average of nearly 30 hours per week—close to a full-time job on top of their academics.
Additionally, among undergraduate students who work 20 hours per week or more, 22.8% are still experiencing food insecurity, demonstrating the insufficiency of earnings to meeting student basic needs and the ineffective nature of current restrictions on SNAP. At community colleges, 23.6% of students who work 20 hours per week or more are experiencing food insecurity.
On average, graduate students report working even more than undergraduates—an average of 28.5 hours per week. Among only graduate students with jobs (excluding those who report zero hours), the average hours worked is 34.8 hours per week, a significant time burden on top of academic coursework.
Table 8: Average working hours of undergraduate students having jobs while enrolled by institution sectors
Conclusions
The NPSAS:20 data shed new light on student experiences in higher education and demonstrate the urgent challenge of basic needs insecurity in college, for both undergraduate and graduate students. With this rich and nationally representative dataset, we observe high levels of food insecurity and homelessness among systemically marginalized students, including Black, Latine, and Indigenous students, parenting students, and students with disabilities.
Nearly 1 in 4 undergraduate students, and more than 1 in 10 graduate students, are experiencing food insecurity—totaling more than 4 million students that don’t have enough to eat. Undergraduates experienced food insecurity at twice the rate of all U.S. households. When students can’t eat, they can’t learn. College leaders and policymakers must come together to support reliable and nutritious food, and safe and affordable housing, for students.
All sectors and types of institutions of higher education are affected by student basic needs insecurity. The Hope Center looks forward to providing further analyses of these data, releasing our own student basic needs survey data later this fall, and helping higher education leaders and policymakers improve student success and wellbeing.
Source and Notes
Source: U.S. Department of Education, National Center for Education Statistics, National Postsecondary Student Aid Study: 2020 Undergraduate Students (NPSAS:UG). U.S. Department of Education, National Center for Education Statistics, National Postsecondary Student Aid Study: 2020 Graduate Students (NPSAS:GR).
Notes: ““!” Interpret data with caution. Estimate is unstable because the standard error represents more than 30 percent of the estimate. The weight variable used in this analysis is WTA000. Detail may not sum to totals because of rounding.” For undergraduate students, community colleges include Public 2-year and Public 4-year non-doc-granting, primarily subbacc colleges based on NPSAS institution sector - 11 categories. Public 4-year colleges & universities include Public 4-year non-doc-granting, primarily bacc and Public 4-year doctorate-granting higher education institutions based on NPSAS institution sector - 11 categories. Private non-profit 4-year colleges & universities include Private non-profit 4-year nondoctorate and Private non-profit 4-year doctorate-granting higher education institutions based on NPSAS institution sector - 11 categories. Private for-profit colleges & universities include Private for profit less-than-2-year, Private for profit 2-year, and Private for profit 4-year higher education institutions based on NPSAS institution sector - 11 categories. For graduate students, higher education institutions are categorized using NPSAS institution sector (4 with multiple).